Standings team race
Flavio Leccese
2024-03-30
Source:vignettes/articles/team-standings-race.Rmd
team-standings-race.RmdGoal
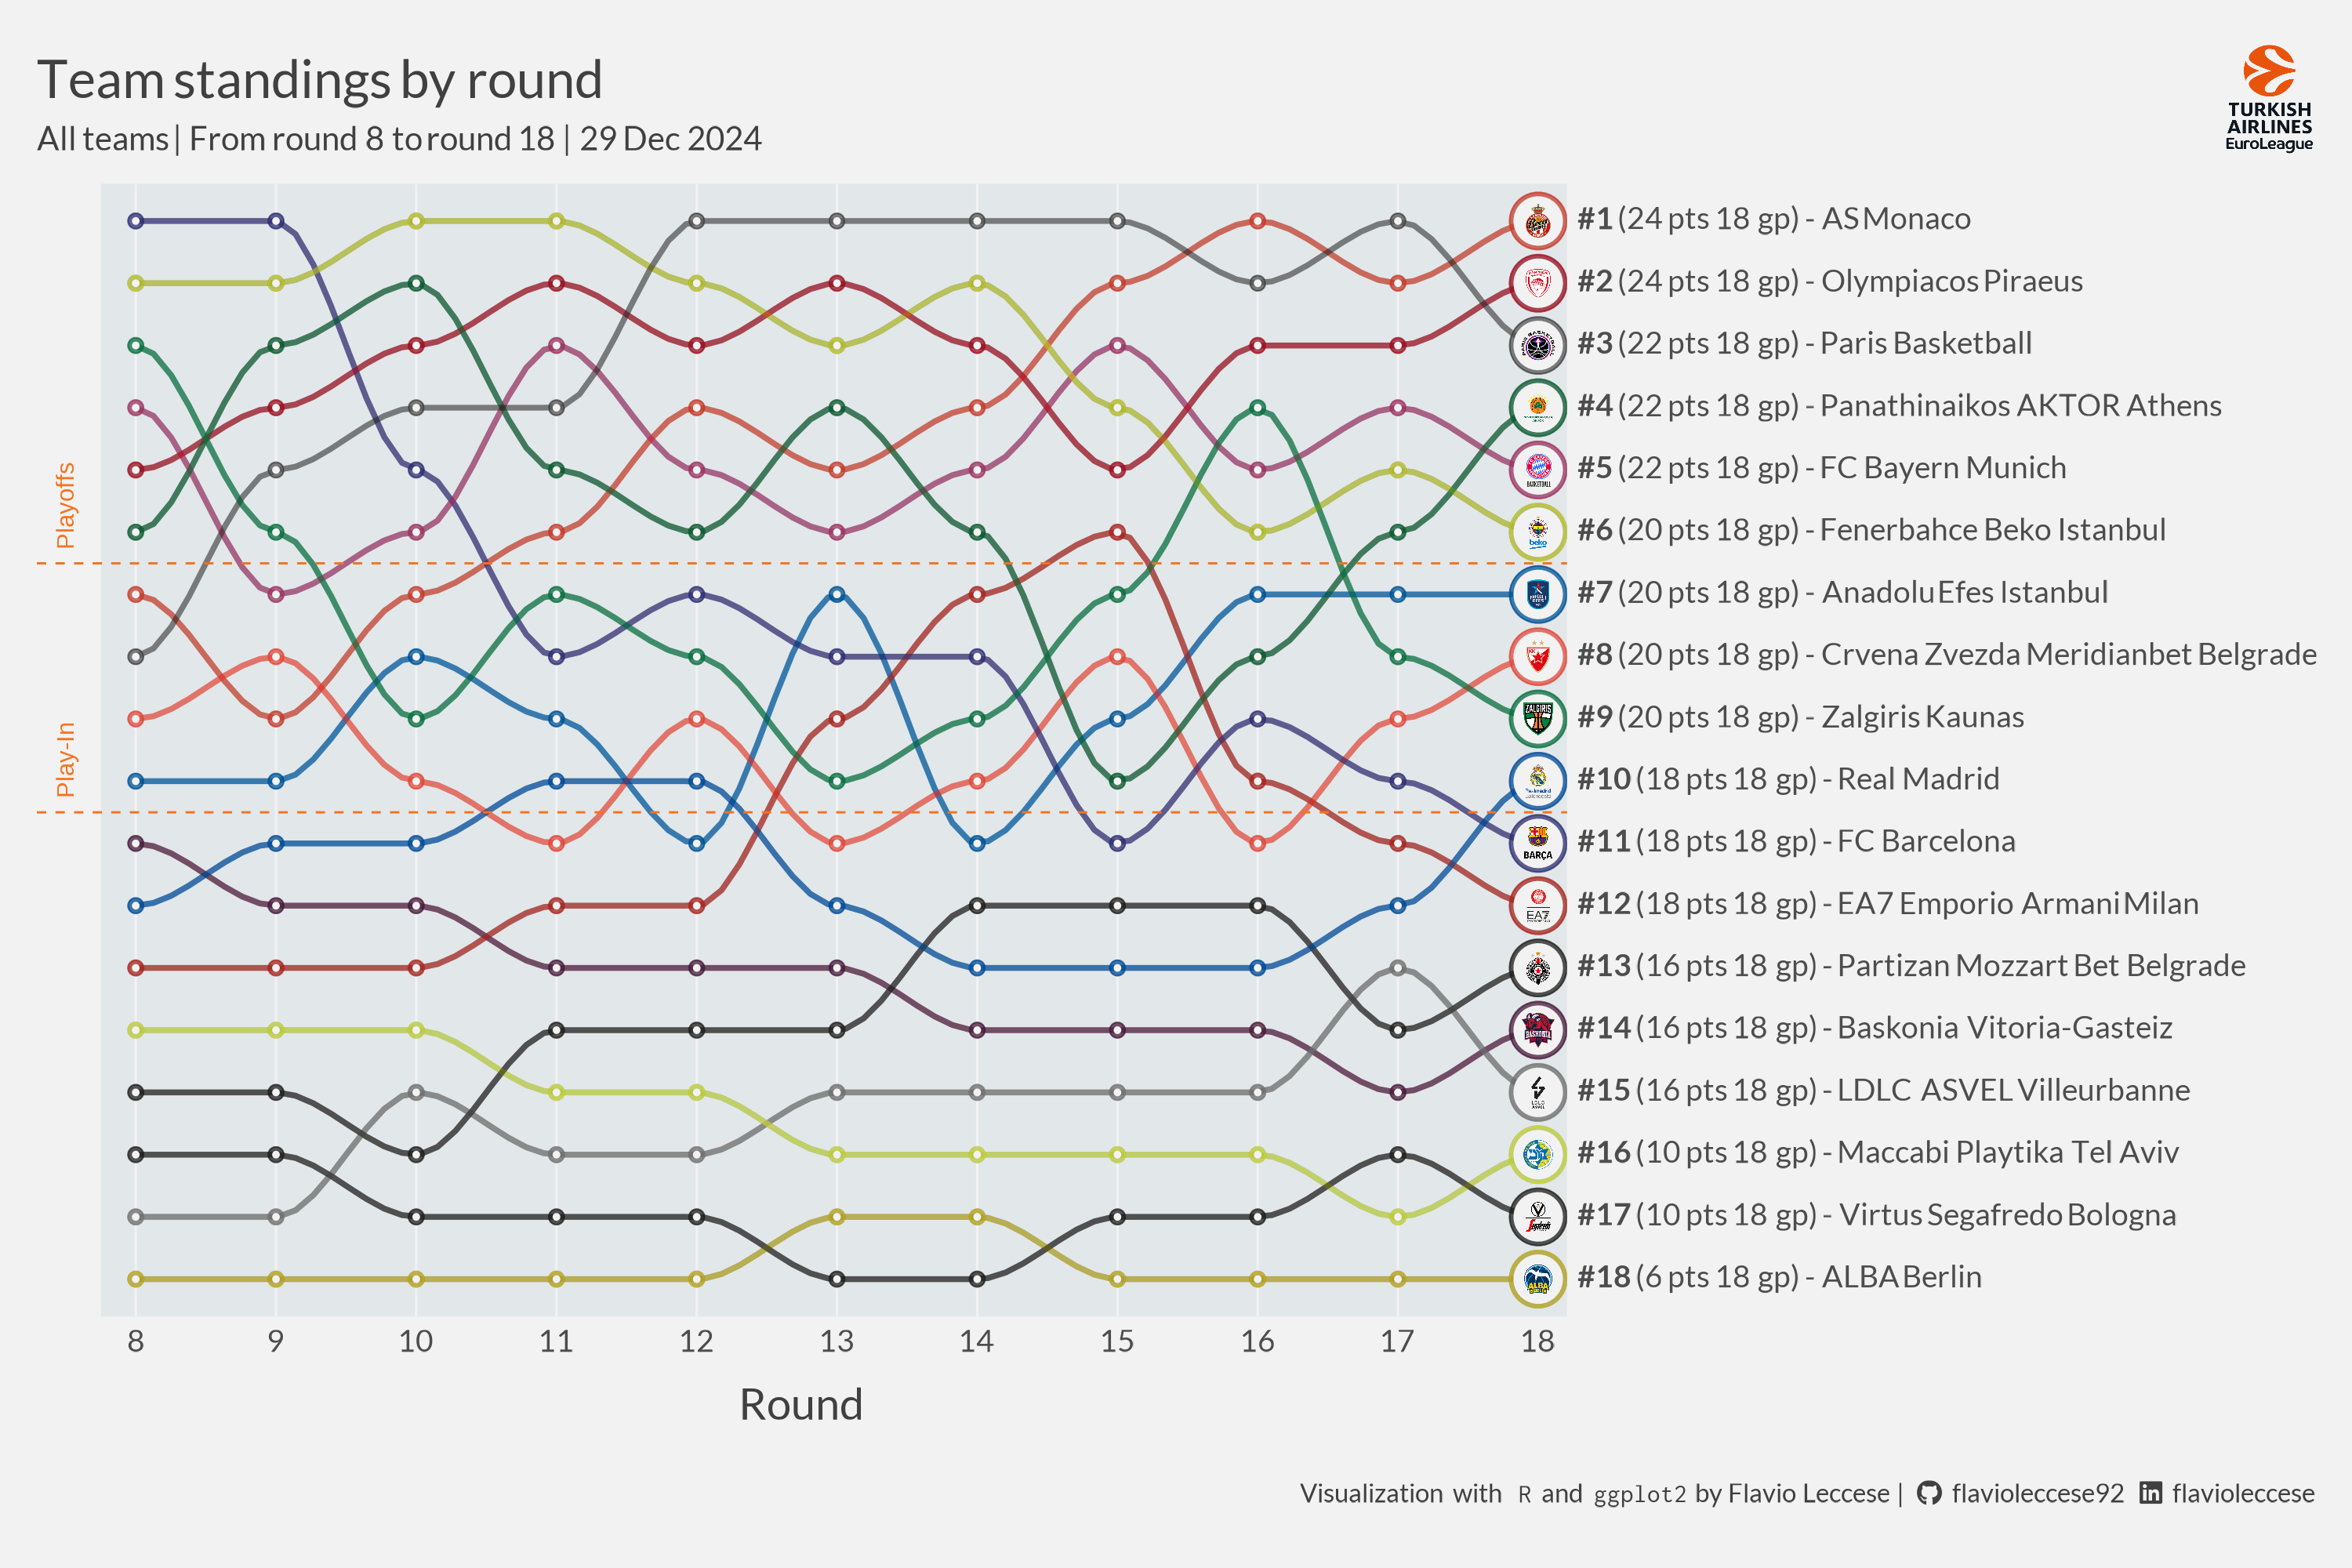
We want to create a chart for each team showing the progression of standings and final competition score.
Data can be obtained through getCompetitionStandings
function.
Resulted plot can be found at the bottom of this page.
Setup
library(euroleaguer)
library(tidyr)
library(dplyr)
library(ggplot2)
library(ggtext)
library(showtext)
library(ggimage)
library(glue)
library(geomtextpath)
library(hexbin)

# Add Lato font (Euroleague official font)
font_add_google("Lato", "Lato")
font_add_google("Inconsolata", "Inconsolata")

# Add Font Awesome for logos
font_add(family = "Font Awesome 6 Brands",
         regular = "figures/fa-brands-400.ttf")
showtext_opts(dpi = 200)
showtext_auto()
Data
CompetitionRounds <- getCompetitionRounds("E2023") %>%
  filter(Sys.Date() >= MaxGameStartDate)

CompetitionStandings <- getCompetitionStandings("E2023", CompetitionRounds$Round)

MaxRound <- max(CompetitionStandings$Round)
MaxGameDate <- CompetitionRounds %>% filter(Round == MaxRound) %>% pull(MaxGameStartDate) %>%
  format(., '%d %b %Y')
NRounds <- 10
MinRound <- MaxRound - NRounds

Teams <- getTeam("E2023", unique(CompetitionStandings$TeamCode))
Data for plot
CompetitionStandings <-
  CompetitionStandings %>%
  left_join(Teams %>% select(TeamCode, PrimaryColor, SecondaryColor),
            by = "TeamCode") %>%
  left_join(CompetitionStandings %>% filter(Round == MaxRound) %>%
              arrange(desc(Position)) %>%
              mutate(
                gp = ifelse(max(GamesPlayed) != min(GamesPlayed), glue(" {GamesPlayed} gp"), ""),
                y = factor(glue("**#{Position}** ({GamesWon*2} pts{gp}) - {TeamName}"),
                                levels = glue("**#{Position}** ({GamesWon*2} pts{gp}) - {TeamName}"))) %>%
              select(y, Position),
            by = "Position") %>%
  filter(Round %in% (MaxRound - NRounds):MaxRound) %>%
  mutate(x = Round)

LastRound <- CompetitionStandings %>% filter(Round == MaxRound)
PreviousRounds <- CompetitionStandings %>% filter(Round < MaxRound)Title, subtitle and caption
PlotTitle <- glue(
"<span style = 'font-size: 32px'>Team standings by round</span><br>
<span style = 'font-size: 20px'>All teams | From round {MaxRound - NRounds} to round {MaxRound} | {MaxGameDate}</span>")
PlotSubtitle <- glue(
"<span><img src = 'figures/euroleague-logo-vertical.png'
height='50'></span>")
PlotCaption <- glue(
"<span>Visualization with </span>
<span style = 'font-family:\"Inconsolata\";'>R</span>
<span>and</span>
<span style = 'font-family:\"Inconsolata\";'>ggplot2</span>
<span>by Flavio Leccese |</span>
<span style = 'font-family:\"Font Awesome 6 Brands\";'></span>
<span>flavioleccese92</span>
<span style = 'font-family:\"Font Awesome 6 Brands\";'></span>
<span>flavioleccese</span>")Plot
# Initialize
e <- CompetitionStandings %>%
  ggplot(aes(x = x, y = y))

# Add vertical lines
e <- e +
  geom_vline(data = PreviousRounds, aes(xintercept = x), colour =  "#f2f2f2")

# Add standing lines by team
e <- e +
  geom_line(stat = "smooth", method = "loess", formula = 'y ~ x',
            aes(colour = SecondaryColor, group = TeamName),
            alpha = 0.50, linewidth = 1.25, se = FALSE, span = 0.25) +
  geom_line(stat = "smooth", method = "loess", formula = 'y ~ x',
            aes(colour = PrimaryColor, group = TeamName),
            alpha = 0.50, linewidth = 1.25, se = FALSE, span = 0.25)

# Add points by round and team
e <- e +
  geom_point(data = PreviousRounds, aes(colour = SecondaryColor), alpha = 0.50, size = 3) +
  geom_point(data = PreviousRounds, aes(colour = PrimaryColor), alpha = 0.50, size = 3) +
  geom_point(data = PreviousRounds, colour = "#f2f2f2", size = 1) +
  geom_point(data = LastRound, aes(colour = SecondaryColor), alpha = 0.50, size = 12) +
  geom_point(data = LastRound, aes(colour = PrimaryColor), alpha = 0.50, size = 12) +
  geom_point(data = LastRound, colour = "#f2f2f2", size = 10)

# Add lines of Play-In and Playoffs
e <- e +
  geom_rect(aes(xmin = -Inf, xmax = MinRound - 0.25,
                ymin = -Inf, ymax = +Inf),
            fill = "#f2f2f2", color = NA) +
  geom_hline(data = PlayInsOff, aes(yintercept = as.numeric(y) - 0.5), colour = "#F47321",
             linetype = "dashed") +
  geom_text(data = PlayInsOff, angle = 90, hjust = 0, colour = "#F47321",
            aes(label = Label, y = as.numeric(y) - 0.25, x = MinRound - 0.5))

# Add images + general theme setting
e <- e +
  geom_image(data = TeamImage, aes(y = y, image = TeamImagesCrest), size = 0.03,
             image_fun = function(img) { magick::image_crop(img) }) +
  scale_colour_identity() +
  scale_y_discrete(position = "right") +
  scale_x_continuous(breaks = MinRound:MaxRound, labels = MinRound:MaxRound,
                     min = MinRound, expand = c(0.01, 0.1)) +
  theme(
    # General
    panel.grid.major = element_blank(),
    panel.grid.minor = element_blank(),
    panel.background = element_rect(fill = "#e2e7ea"),
    plot.background = element_rect(fill = "#f2f2f2", colour = "transparent"),
    plot.margin = margin(28, 15, 28, 17),
    text = element_text(color = "#404040", family = "Lato"),
    # Axis labels
    axis.ticks = element_blank(),
    axis.title.y = element_blank(),
    axis.title.x = element_text(size = 20, vjust = -2.5),
    axis.text.y.right = element_markdown(size = 14),
    axis.text.x = element_text(size = 14, vjust = 0.5),
    # Legend
    legend.background = element_blank(),
    legend.box.background = element_blank(),
    legend.key = element_blank(),
    legend.position = 'bottom',
    legend.justification = 'left',
    legend.direction = 'horizontal',
    legend.margin = margin(10, 0, 15, 0),
    legend.box.spacing = unit(0, "pt"),
    # Title, subtitle, caption
    plot.title = element_markdown(
      lineheight = 1, size = 24, hjust = 0, vjust = 1, margin = margin(0, 0, -20, 0)),
    plot.title.position = "plot",
    plot.subtitle = element_markdown(
      hjust = 1, margin = margin(-33, 3, -50, 0)),
    plot.caption = element_markdown(
      size = 12, margin = margin(30, 0, 0, 3)),
    plot.caption.position = "plot",
    # Facet
    strip.background = element_rect(fill = "#F47321"),
    strip.text = element_text(colour = "black", hjust = 0)
  ) +
  labs(title = PlotTitle, subtitle = PlotSubtitle, caption = PlotCaption,
       x = "Round", y = "")