Court team stats
Flavio Leccese
2024-03-30
Source:vignettes/articles/team-stats-court.Rmd
team-stats-court.RmdGoal
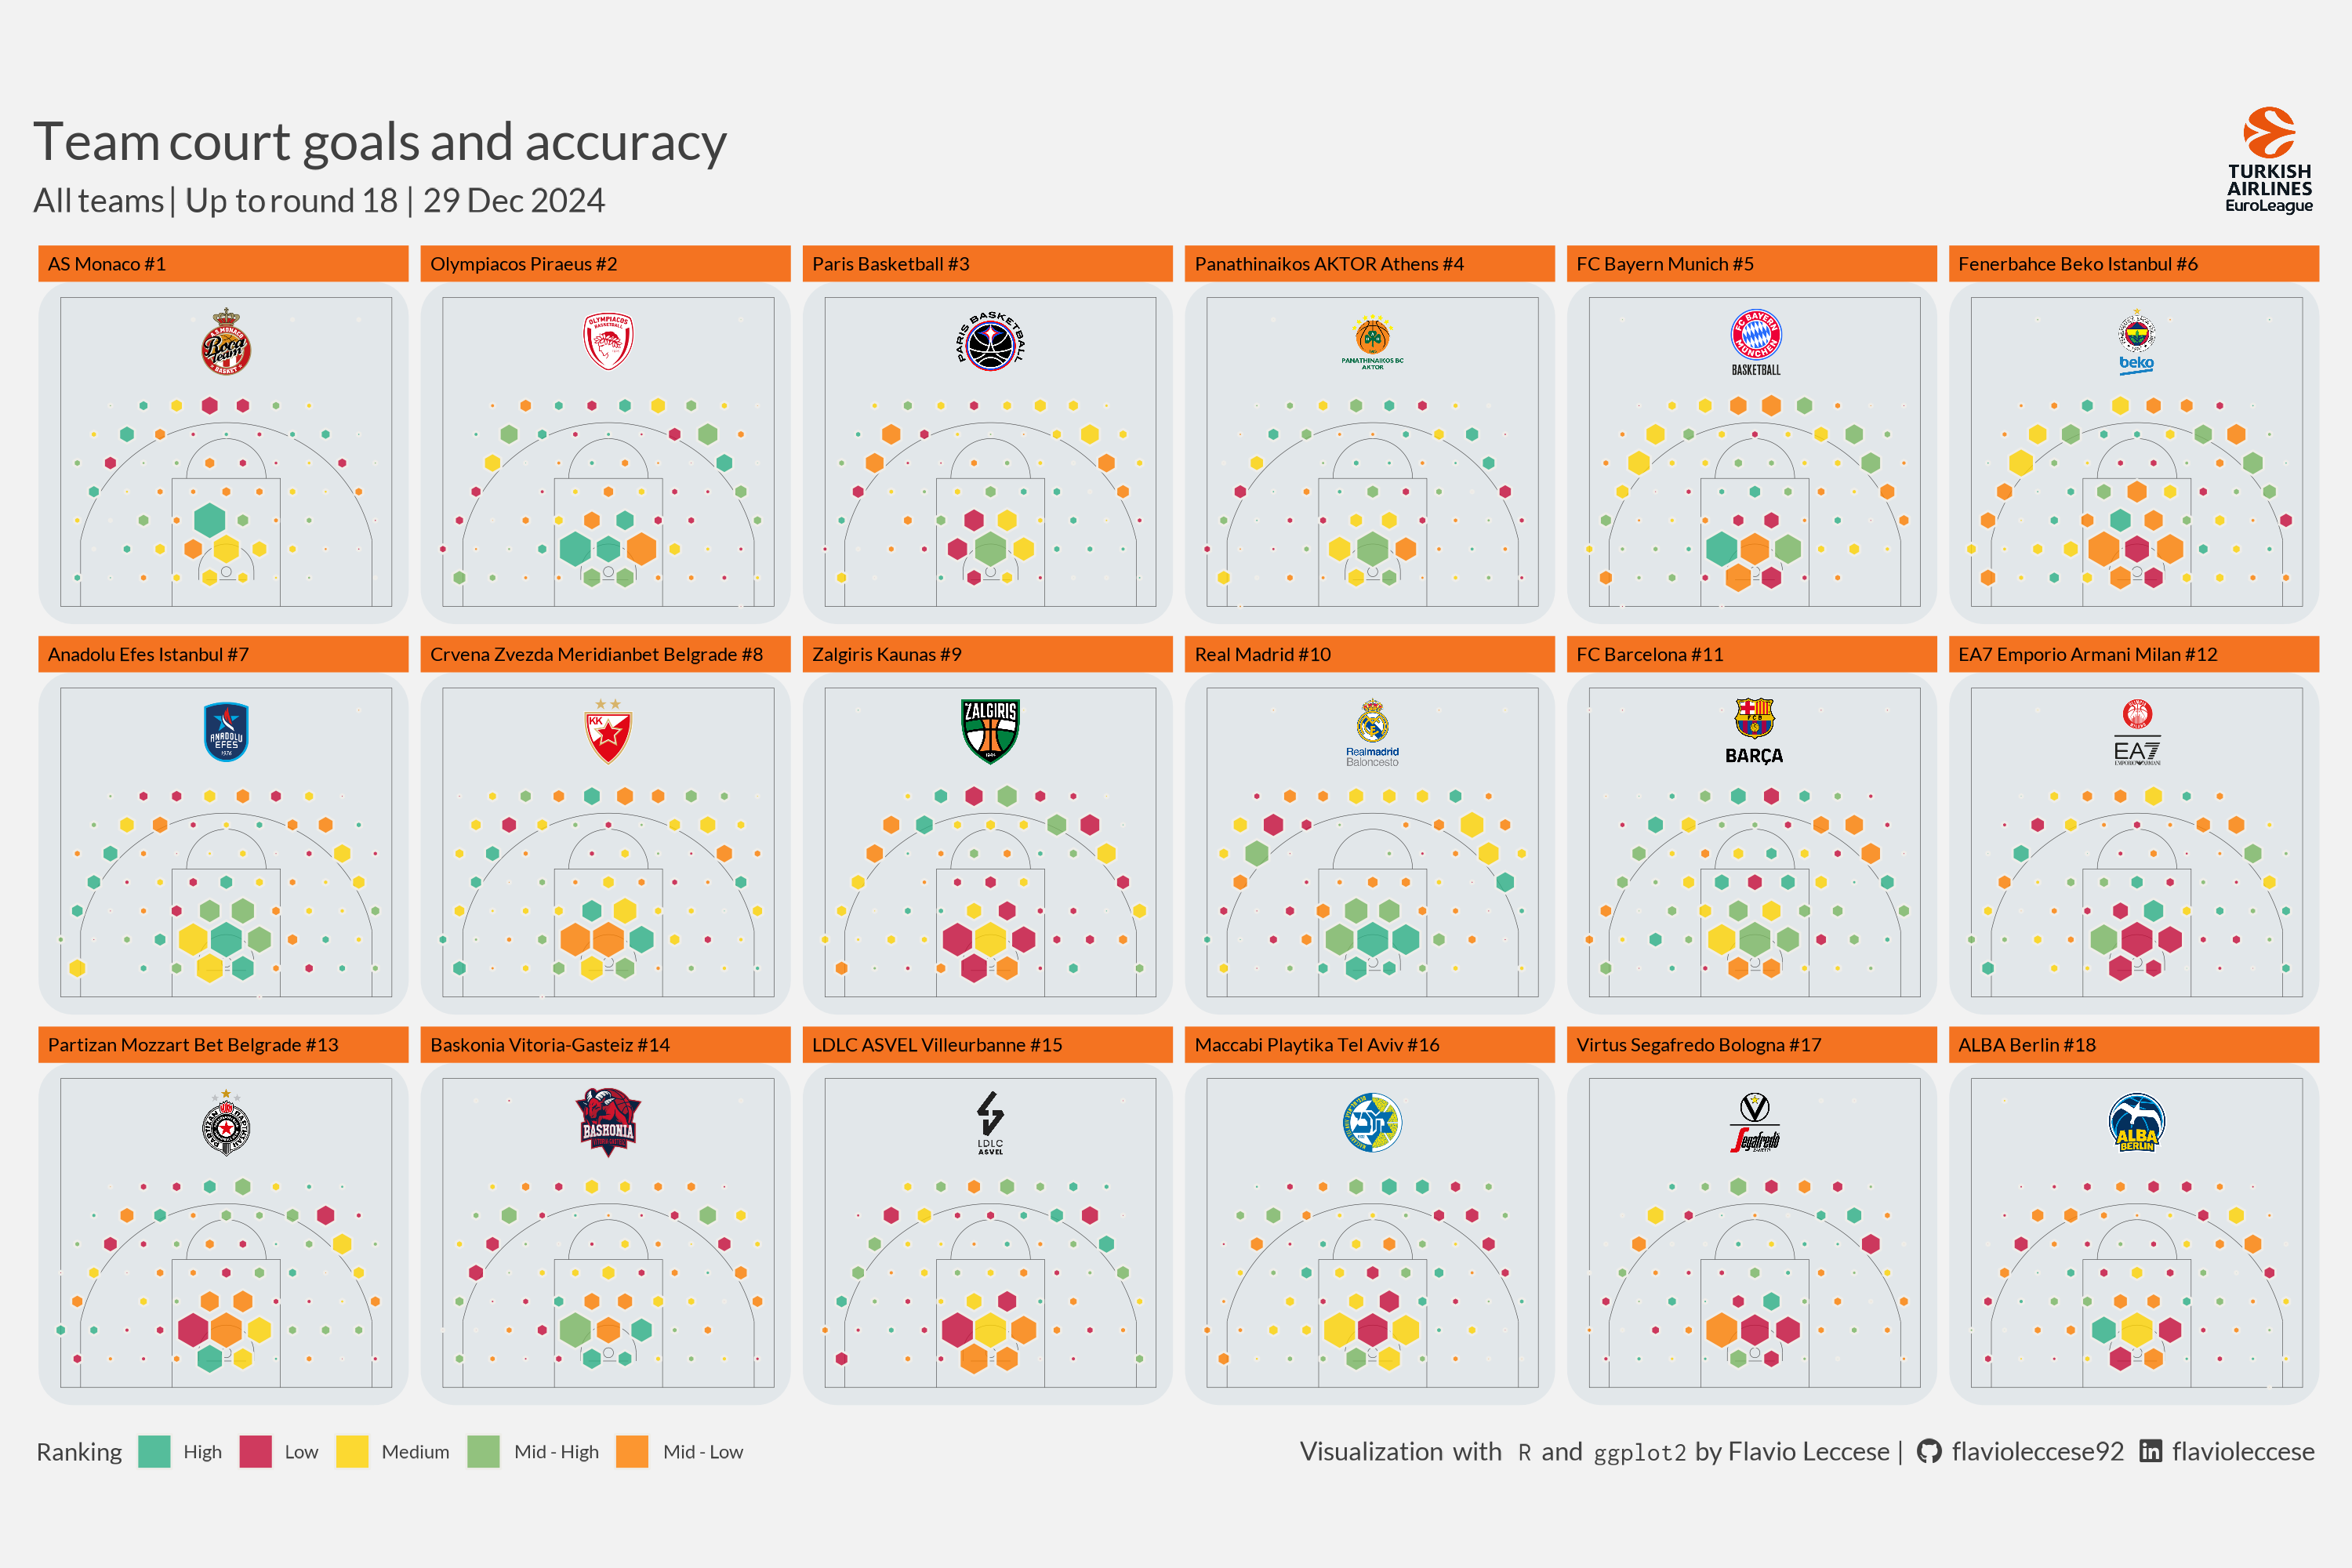
We want to create a chart for each team showing the field-goals percentage and overall attempts on the court.
Colours are ranging from #C70D3A (lower percentages) to #2EB086) (high percentages) and size of hexagons ⬢ are corresponding to the number of attempts.
Data can be obtained through getGamePoints function.
Resulted plot can be found at the bottom of this page.
Setup
library(euroleaguer)
library(tidyr)
library(dplyr)
library(ggplot2)
library(ggtext)
library(showtext)
library(ggimage)
library(glue)
library(geomtextpath)
library(hexbin)

# Add Lato font (Euroleague official font)
font_add_google("Lato", "Lato")
font_add_google("Inconsolata", "Inconsolata")

# Add Font Awesome for logos
font_add(family = "Font Awesome 6 Brands",
         regular = "figures/fa-brands-400.ttf")
showtext_opts(dpi = 200)
showtext_auto()
Data
CompetitionRounds <- getCompetitionRounds("E2023") %>%
  filter(Sys.Date() >= MaxGameStartDate)

MaxRound <- max(CompetitionRounds$Round)
MaxGameDate <- format(as.Date(max(CompetitionRounds$MaxGameStartDate)),
                     '%d %b %Y')

CompetitionStandings <- getCompetitionStandings("E2023", MaxRound)
CompetitionGames <- getCompetitionGames("E2023", CompetitionRounds$Round) %>%
  filter(Status == "result")
GamePoints <- getGamePoints("E2023", CompetitionGames$GameCode)
Court
source("scripts/construct-court.R")
Court <- ConstructCourt()

# Define parameters for fitting coords into Court
DistX <- 1.5; DistY <- DistX*sqrt(3)/2
CourtMinX <- min(Court$x); CourtMaxX <- max(Court$x)
CourtMinY <- min(Court$y); CourtMaxY <- max(Court$y)
nx <- ceiling((CourtMaxX - CourtMinX)/DistX)
ny <- ceiling((CourtMaxY - CourtMinY)/DistY)
Origin <- c(CourtMinX, CourtMinY)
Hexgrid
HexGrid <- tibble(
  Hex_ID = 1:(nx*ny),
  x = sort(c(rep(seq(from = 0, by = DistX, length.out = nx),
                 each = ceiling(ny/2)),
             rep(seq(from = DistX/2, by = DistX, length.out = nx),
                 each = floor(ny/2)))) + Origin[1],
  y = rep(c(seq(from = 0, by = 2*DistY, length.out = ceiling(ny/2)),
            seq(from = DistY, by = DistX*sqrt(3),
                length.out = floor(ny/2))) + Origin[2], times = nx)) %>%
  filter(x >= CourtMinX, x <= CourtMaxX)

x_grid <- sort(unique(HexGrid$x))
y_grid <- sort(unique(HexGrid$y))


# Create dataset for stats
GamePoints <- GamePoints %>%
  filter(Action_ID != "FTM") %>%
  mutate(x = CoordX/100, y = CoordY/100 + 1.5,
         x_court = case_when(x > max(Court$x) ~ max(Court$x),
                             x < min(Court$x) ~ min(Court$x), TRUE ~ x),
         y_court = case_when(y > max(Court$y) ~ max(Court$y),
                             y < min(Court$y) ~ min(Court$y), TRUE ~ y),
         rn = row_number()) %>%
  select(TeamCode, GameCode, Player_ID, Action_ID, Action,
         x_court, y_court, rn) %>%
  mutate(x = cut(x_court, breaks = x_grid, dig.lab = max(nchar(x_grid))) %>%
           gsub("\\(|\\]", "", .),
         y = cut(y_court, breaks = y_grid, dig.lab = max(nchar(y_grid))) %>%
           gsub("\\(|\\]", "", .)) %>%
  separate_wider_delim(x, delim = ",", names = c("x1", "x2")) %>%
  separate_wider_delim(y, delim = ",", names = c("y1", "y2")) %>%
  pivot_longer(cols = c("x1", "x2"), values_to = "x", names_to = "x_name") %>%
  pivot_longer(cols = c("y1", "y2"), values_to = "y", names_to = "y_name") %>%
  mutate(x = as.numeric(x), y = as.numeric(y)) %>%
  inner_join(HexGrid, by = c("x", "y")) %>%
  mutate(diff = (abs(x_court - x) + abs(y_court - y))/2) %>%
  slice_min(order_by = diff, by = rn) %>%
  group_by(TeamCode, Hex_ID, x, y) %>%
  summarise(FGM = sum(ifelse(grepl("M", Action_ID), 1, 0), na.rm = TRUE),
            FGA = n(), .groups = "drop") %>%
  group_by(Hex_ID) %>%
  mutate(Value = ntile(FGM/FGA, 5),
         FillValue = case_when(Value == 5 ~ "High", Value == 4 ~ "Mid - High",
                               Value == 3 ~ "Medium", Value == 2 ~ "Mid - Low",
                               Value == 1 ~ "Low", TRUE ~ NA)) %>%
  ungroup() %>%
  group_by(TeamCode) %>%
  mutate(Hex_ID_Max_Area = max(FGA)) %>%
  ungroup() %>%
  mutate(Hex_Area = FGA/Hex_ID_Max_Area)

HexGridValues <- NULL
for (i in 1:nrow(GamePoints)) {
  TeamCode <- GamePoints[i,]$TeamCode
  Hex_ID <- GamePoints[i,]$Hex_ID
  Area <- as.numeric(GamePoints[i,]$Hex_Area)*((DistY*2/3)^2*3*sqrt(3)/2)
  CenX <- as.numeric(GamePoints[i,]$x)
  CenY <- as.numeric(GamePoints[i,]$y)

  DelY <- sqrt(2*Area/sqrt(3)/3)
  DelX <- DelY*sqrt(3)/2

  HexGridValues <-
    tibble(
      Hex_x = c(CenX + 0, CenX + DelX, CenX + DelX,
                CenX + 0, CenX - DelX, CenX - DelX),
      Hex_y = c(CenY - DelY, CenY - DelY/2, CenY + DelY/2,
                CenY + DelY, CenY + DelY/2, CenY - DelY/2)) %>%
    bind_cols(TeamCode = TeamCode, Hex_ID = Hex_ID, .) %>%
    bind_rows(HexGridValues, .)
}
Data for plot
GamePoints <- GamePoints %>%
  left_join(HexGridValues, by = c("TeamCode", "Hex_ID")) %>%
  left_join(CompetitionStandings %>%
              select(TeamCode, TeamName, TeamImagesCrest, Position),
            by = "TeamCode") %>%
  arrange(Position) %>%
  mutate(TeamName = glue("{TeamName} #{Position}")) %>%
mutate(TeamName = factor(TeamName, levels = unique(.$TeamName)))Title, subtitle and caption
PlotTitle <- glue(
"<span style = 'font-size: 32px'>Team court goals and accuracy</span><br>
<span style = 'font-size: 20px'>All teams | Up to round {MaxRound} | {MaxGameDate}</span>")
PlotSubtitle <- glue(
"<span><img src = 'figures/euroleague-logo-vertical.png'
height='50'></span>")
PlotCaption <- glue(
"<span>Visualization with </span>
<span style = 'font-family:\"Inconsolata\";'>R</span>
<span>and</span>
<span style = 'font-family:\"Inconsolata\";'>ggplot2</span>
<span>by Flavio Leccese |</span>
<span style = 'font-family:\"Font Awesome 6 Brands\";'></span>
<span>flavioleccese92</span>
<span style = 'font-family:\"Font Awesome 6 Brands\";'></span>
<span>flavioleccese</span>")Plot
# Initialize
e <- GamePoints %>%
  ggplot(aes(x = Hex_x, y = Hex_y))

# Add court polygon
e <- e +
  geom_path(
    data = Court, aes(x = x, y = y, group = type),
    linewidth = 0.1, colour = "#404040", alpha = 1)

# Add hexagons
e <- e +
  geom_polygon(
    aes(group = Hex_ID, fill = FillValue), color = "#eeede9", alpha = 0.8)

# Facet by team + general theme setting
e <- e +
  scale_fill_manual(
    name = "Ranking",
    values = c("Low" = "#C70D3A", "Mid - Low" = "#FF7F00", "Medium" = "#FFD301",
               "Mid - High" = "#7BB662", "High" = "#2EB086")) +
  geom_image(
    data = TeamImage, aes(x = x, y = y, image = TeamImagesCrest), size = 0.2,
    image_fun = function(img) { magick::image_crop(img) }) +
  coord_fixed() +
  facet_wrap(~ TeamName, ncol = 6) +
  theme(
    # General
    panel.grid.major = element_blank(),
    panel.grid.minor = element_blank(),
    panel.background = element_rect_round(fill = "#e2e7ea"),
    plot.background = element_rect(fill = "#f2f2f2", colour = "transparent"),
    plot.margin = margin(28, 15, 8, 15),
    text = element_text(color = "#404040", family = "Lato"),
    # Axis labels
    axis.ticks = element_blank(),
    axis.title.y = element_blank(),
    axis.text.y = element_blank(),
    axis.title.x = element_blank(),
    axis.text.x = element_blank(),
    # Legend
    legend.background = element_blank(),
    legend.box.background = element_blank(),
    legend.key = element_blank(),
    legend.position = 'bottom',
    legend.justification = 'left',
    legend.direction = 'horizontal',
    legend.margin = margin(10, 0, 3, 0),
    legend.box.spacing = unit(0, "pt"),
    # Title, subtitle, caption
    plot.title = element_markdown(
      lineheight = 1, size = 24, hjust = 0, vjust = 1, margin = margin(0, 0, -20, 0)),
    plot.title.position = "plot",
    plot.subtitle = element_markdown(
      hjust = 1, margin = margin(-33, 3, -50, 0)),
    plot.caption = element_markdown(
      size = 12, margin = margin(-25, 0, 0, 3)),
    plot.caption.position = "plot",
    # Facets
    strip.background = element_rect(fill = "#F47321"),
    strip.text = element_text(colour = "black", hjust = 0)
  ) +
  labs(title = PlotTitle, subtitle = PlotSubtitle, caption = PlotCaption,
       x = "", y = "")