Radar team stats
Flavio Leccese
2024-03-30
Source:vignettes/articles/team-stats-radar.Rmd
team-stats-radar.RmdGoal
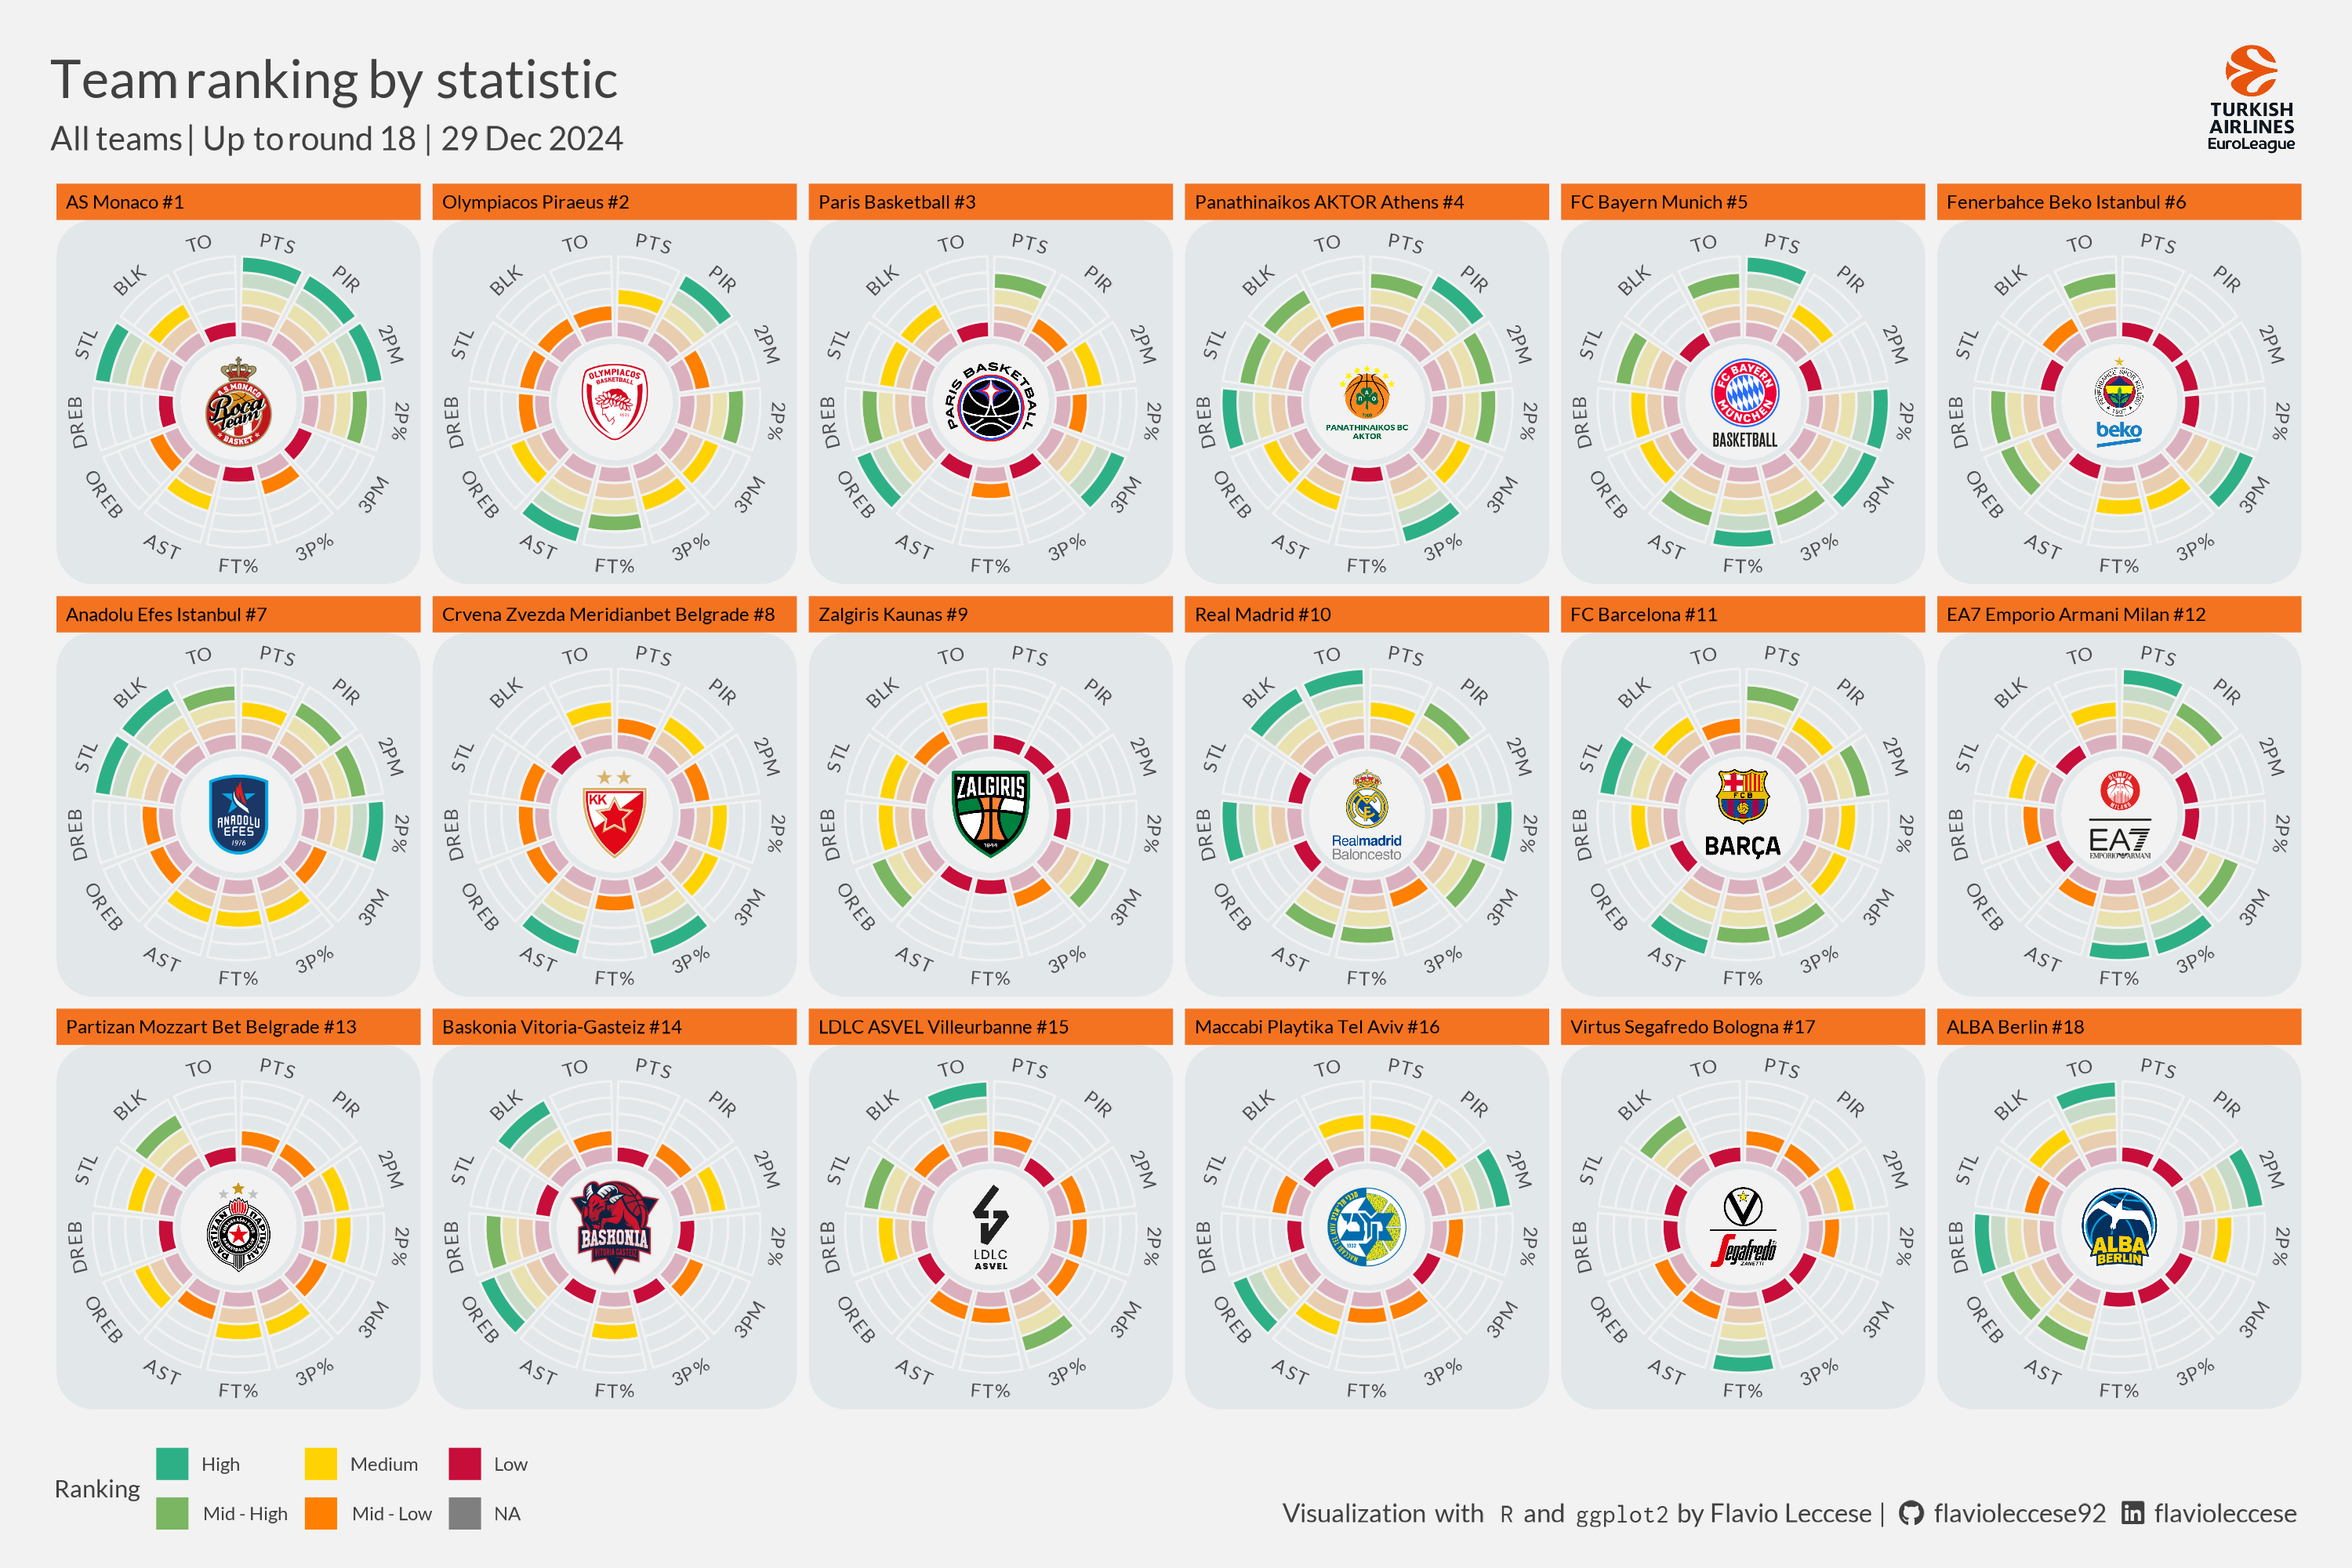
We want to create a chart for each team showing the normalized
ranking for points (PTS), valuation (PIR),
2-points made (2PM), 2-points % (2P%),
3-points made (3PM), 3-points % (3P%),
free-throws % (FT%), assists (AST), offensive
rebounds (OREB), defensive rebounds (DREB),
steals (STL), blocks (BLK), and turnover
(TO).
Colours are ranging from #C70D3A to #2EB086.
Data can be obtained through getTeamStats function.
Resulted plot can be found at the bottom of this page.
Setup
library(euroleaguer)
library(tidyr)
library(dplyr)
library(ggplot2)
library(ggtext)
library(showtext)
library(ggimage)
library(glue)
library(geomtextpath)
library(hexbin)

# Add Lato font (Euroleague official font)
font_add_google("Lato", "Lato")
font_add_google("Inconsolata", "Inconsolata")

# Add Font Awesome for logos
font_add(family = "Font Awesome 6 Brands",
         regular = "figures/fa-brands-400.ttf")
showtext_opts(dpi = 200)
showtext_auto()
Data
CompetitionRounds <- getCompetitionRounds("E2023") %>%
  filter(Sys.Date() >= MaxGameStartDate) %>%
  slice_head(n = 1)

MaxRound <- max(CompetitionRounds$Round)
MaxGameDate <- format(as.Date(max(CompetitionRounds$MaxGameStartDate)),
                     '%d %b %Y')

CompetitionStandings <- getCompetitionStandings("E2023", CompetitionRounds$Round)
TeamStats <- getTeamStats("E2023", CompetitionStandings$TeamCode)
Data for plot
# Pick stats
stats <- c("PTS", "PIR", "2PM", "2P%", "3PM", "3P%", "FT%", "AST",
          "OREB", "DREB", "STL", "BLK", "TO")

# Create dataset for stats
TeamStatsForPlot <- TeamStats$TeamAveragePerGame %>%
  select(TeamCode, all_of(stats)) %>%
  mutate(., across(all_of(stats), ~ ntile(., 5))) %>%
  pivot_longer(cols = all_of(stats), names_to = "Stat", values_to = "Value") %>%
  mutate(ActualValue = Value) %>%
  group_by(TeamCode, Stat) %>%
  complete(Value = -3:5) %>%
  mutate(ActualValue = max(ActualValue, na.rm = TRUE)) %>%
  ungroup() %>%
  mutate(AlphaValue = case_when(
    Value <= 0 ~ "Empty", Value == ActualValue ~ "Actual",
    Value < ActualValue ~ "Less", TRUE ~ "Empty"),
    FillValue = case_when(
      Value == 5 ~ "High", Value == 4 ~ "Mid - High",
      Value == 3 ~ "Medium", Value == 2 ~ "Mid - Low",
      Value == 1 ~ "Low", TRUE ~ NA) %>%
      factor(., levels = c("High", "Mid - High", "Medium", "Mid - Low", "Low")),
         GroupValue = factor(Value, levels = 5:-3),
         SizeValue = ifelse(Value <= 0, "Empty", "Colored")) %>%
  left_join(CompetitionStandings %>%
              select(TeamCode, TeamName, Position, TeamImagesCrest),
            by = "TeamCode") %>%
  arrange(Position) %>%
  mutate(Team = glue("{TeamName} #{Position}")) %>%
  mutate(Team = factor(Team, levels = unique(.$Team)),
Stat = factor(Stat, levels = stats))Title, subtitle and caption
PlotTitle <- glue(
"<span style = 'font-size: 32px'>Team ranking by statistic</span><br>
<span style = 'font-size: 20px'>All teams | Up to round {MaxRound} |
{MaxGameDate}</span>")
PlotSubtitle <- glue(
"<span><img src = 'figures/euroleague-logo-vertical.png'
height='50'></span>")
PlotCaption <- glue(
"<span>Visualization with </span>
<span style = 'font-family:\"Inconsolata\";'>R</span>
<span>and</span>
<span style = 'font-family:\"Inconsolata\";'>ggplot2</span>
<span>by Flavio Leccese |</span>
<span style = 'font-family:\"Font Awesome 6 Brands\";'></span>
<span>flavioleccese92</span>
<span style = 'font-family:\"Font Awesome 6 Brands\";'></span>
<span>flavioleccese</span>")Plot
# Initialize
e <- ggplot(TeamStatsForPlot, aes(x = Stat))

# Draw background rectangles and Team image
e <- e +
  geom_rect(xmin = -Inf, xmax = +Inf, ymin = 0, ymax = 0.4, fill = "#f2f2f2") +
  geom_image(data = TeamImage, aes(y = y, image = TeamImagesCrest), size = 0.25,
             image_fun = function(img) { magick::image_crop(img) }) +
  geom_rect(xmin = -Inf, xmax = +Inf, ymin = 0.4, ymax = 1, fill = "#e2e7ea")

# Draw bars of stats
e <- e +
  geom_bar(aes(y = 1, fill = FillValue, group = GroupValue,
               alpha = AlphaValue, linewidth = SizeValue),
           position = "fill", stat = "identity", colour = "#f2f2f2")

# Facet by team + general theme setting
e <- e +
  facet_wrap(~ Team, ncol = 6) +
  scale_x_discrete() +
  coord_curvedpolar(
    clip = "off") +
  scale_alpha_manual(
    values = c("Actual" = 1, "Less" = 0.25, "Empty" = 0), guide = "none") +
  scale_linewidth_manual(
    values = c("Empty" = 0, "Colored" = 0.5), guide = "none") +
  scale_fill_manual(
    name = "Ranking",
    values = c("Low" = "#C70D3A", "Mid - Low" = "#FF7F00", "Medium" = "#FFD301",
               "Mid - High" = "#7BB662", "High" = "#2EB086")) +
  scale_hjust_manual(values = 0.8) +
  theme(
    # General
    panel.grid.major = element_blank(),
    panel.grid.minor = element_blank(),
    panel.background = element_rect_round(fill = "#e2e7ea"),
    plot.background = element_rect(fill = "#f2f2f2", colour = "transparent"),
    plot.margin = margin(28, 15, 8, 15),
    text = element_text(color = "#404040", family = "Lato"),
    # Axis labels
    axis.ticks = element_blank(),
    axis.title.y = element_blank(),
    axis.text.y = element_blank(),
    axis.title.x = element_blank(),
    axis.text.x = element_text(vjust = 0.5),
    # Legend
    legend.background = element_blank(),
    legend.box.background = element_blank(),
    legend.key = element_blank(),
    legend.position = 'bottom',
    legend.justification = 'left',
    legend.direction = 'horizontal',
    legend.margin = margin(10, 0, 3, 0),
    legend.box.spacing = unit(0, "pt"),
    # Title, subtitle, caption
    plot.title = element_markdown(
      lineheight = 1, size = 24, hjust = 0, vjust = 1, margin = margin(0, 0, -20, 0)),
    plot.title.position = "plot",
    plot.subtitle = element_markdown(
      hjust = 1, margin = margin(-33, 3, -50, 0)),
    plot.caption = element_markdown(
      size = 12, margin = margin(-25, 0, 0, 3)),
    plot.caption.position = "plot",
    # Facets
    strip.background = element_rect(fill = "#F47321"),
    strip.text = element_text(colour = "black", hjust = 0)
  )  +
  labs(title = PlotTitle, subtitle = PlotSubtitle, caption = PlotCaption,
       x = "", y = "")